Let's face it! No one wants to login and sift through data all day long, especially if you are managing multiple websites. It can get really repetitive and waste a lot of time switching between websites, marketing channels, reporting tools (and different reports within those reporting tools).
To save time and get actionable insights right away - I highly suggest you setup your own Google Data Studio reports (or use the already made templates!)
Do you need to setup your own custom Google Data Studio reports?
Short answer is no! Unless you are working with multiple clients and they request specific data sets or are looking for very specific data sets not found in default templates, then there is no reason for you to waste time and setup custom google data studio reports!
There are over 50+ pre-built templates ready for you to use! All you have to do is connect your report to the appropriate marketing channel to see your data. I will be showing you how to do that as well as how to setup custom google data studio reports, if you wish to do so.
What channels can I connect to Google Data Studio reports?
As of writing this post, here are the channels you can use with your Google Data Studio reports:
- Campaign Manager 360
- Display & Video 360
- Firebase (via BigQuery)
- Google Ad Manager 360
- Google Ads
- Google Analytics
- Google Cloud Storage
- Google Sheets
- Google Surveys
- Search Ads 360
- Search Console
- YouTube Analytics
You can find the complete list here.
What kind of access do I need to connect these channels?
It is best if you have administrator privileges to channels you want to add to your Google Data Studio report. The access is required because Google Data Studio requires permissions to be able to show the data in the reports.
It is also best to have administrator access incase you want to pull very specific data which will require you to create things like advanced segments, when it comes to Google Analytics reports
Benefits of having a Google Data Studio report setup
There are many benefits to having a Google Data Studio report setup.
Save Time
This is by far the number #1 benefit to having a report setup. You will no longer need to login to view your data, you can simply click on your Google Data Studio link and bam! That data is presented for you with filter and other options, incase you would like to customize it.
Depending on how your report is setup and what it shows, you will also be presented with all the information you need to make informed decisions. You will no longer need to sift through data in different sections with Google Analytics for example, everything is right there on one screen!
Real Time Data
Data in your reports is updated automatically as data comes in. You will be able to see things as they happen and quickly. This makes decision making easier and faster - enabling you improve your performance on the fly.
Convenience
Let's say you have multiple websites or clients. It is much easier to have one link to a Google Data Studio report with all your data on it, than having to send or go through multiple reporting channels every week. All the data is presented to you and can always be modified as you progress.
Shareability
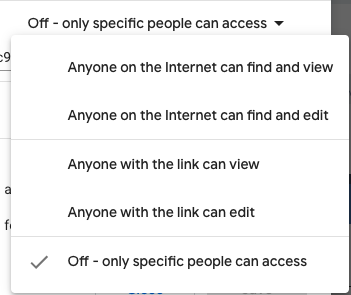
With Google Data Studio reports, you can create shareable links, same as you would with a Google doc. Access can be adjusted for anyone with the link, people within your company or any of the other options available to Google Drive users. Once you have your shareable link created - you should bookmark it for easy access in the future
What data should I include in my reports?
That is totally up to you, however if you are not familiar with all the metrics, channels and KPIs available. I would recommend you stick with the default data provided in the pre-built templates. Those are usually sufficient to show you what is working/not, which you can then explore further if needed.
Creating Google Data Studio report from a template
First, you need to make sure you are logged in with either a gmail account or a Google suite connected email. You need to have an account with Google as a start.
Assuming you are already logged in to your account, you will need to go here to get started: https://datastudio.google.com/. You can either Start with a template or start from scratch. It's always easier to start with a template so that is what I will do for now.
[Assuming you are still on the main GDS (Google Data Studio) screen]
- To get started with a template, you can either click here to go straight to the template gallery or click on "Template Gallery" (found in the top right hand corner). Then click on See More. That will take you to the template gallery.
- Choose a template based on your business type and channel. For example, if you own an e-commerce shop and doing Google Shopping campaigns in Google Ads, you would want to choose the "Ecommerce PPC" report. It has both Google Analytics + Google Ads connected to it (as indicated in gray text right under the report image)

- Click on the report of your choice.
- You will be presented with a preview of what the report looks like. If you like what you see and would like to use the report, then click on "Use Template" (found in the top right hand side bar)

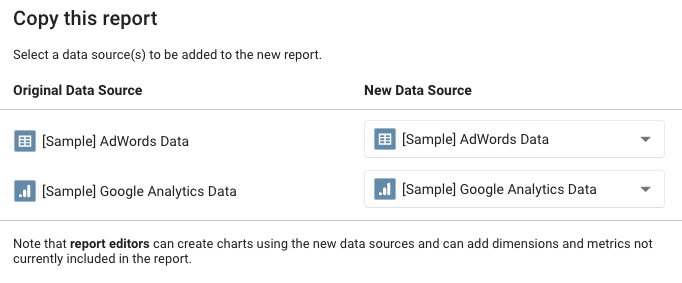
- You will be presented with a screen that asks you to "Copy this report". That screen will ask you to connect your accounts to the report

- Under the column called "New Data Source" you will be presented with the channels found in that template, which you will need to connect. Depending on what template you chose, the channels will be different. In my example, I have Google Adwords & Google Analytics.
- Now click on the Data Source you wish to connect, then click on "Create New Data Source". In my case, I clicked on "[Sample] AdWords Data".
- Then click on "Create New Data Source". You will get to screen showing you all the channels
- Click on the appropriate channel. In my example, it's going to be Google Ads.
- You will be presented with a screen which will show you your accounts. Choose the account/website the report is for and click on "Connect", which is found at the top right hand corner.
- On the next screen, just click on "Add To Report"
- Next, you will want to connect any other channels to the report (if there are any). In my case, I have to connect Google Analytics as well, so I will go back to step 7 and do that all over again.
- Once you are done connecting your accounts, click on "copy report" and you will get to a screen with your report template and all the data from the accounts you connected presented for you!
That's it! You are done creating the report! Now, you can either view it (by clicking the view btn in the top right hand corner) or share the report with whomever you like.
Make your report shareable
To make your report shareable, so you don't have to be logged in to see it.
- Click on the "Share" button in the top right hand corner.
- Click on the "Manage access" tab
- Choose an option that works best for you (screenshot below)

How to Customize Colors & Styles Of Charts
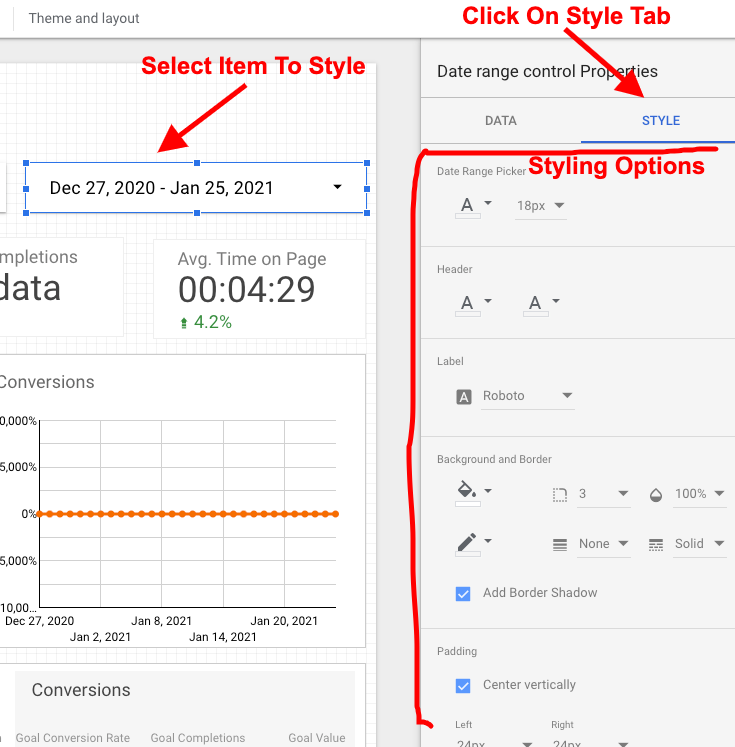
First, click on the chart or item you want to customize. This could be a bar chart, graph chart, pretty much any of the elements you have in your Google Data Studio report.
Once you have the item selected. You will be presented with 2 tabs on the right hand side. One says Data and the other Style. Click on the Style tab and update anything from font size to color. Screenshot below

How To Customize What Data Is Displayed In A Chart
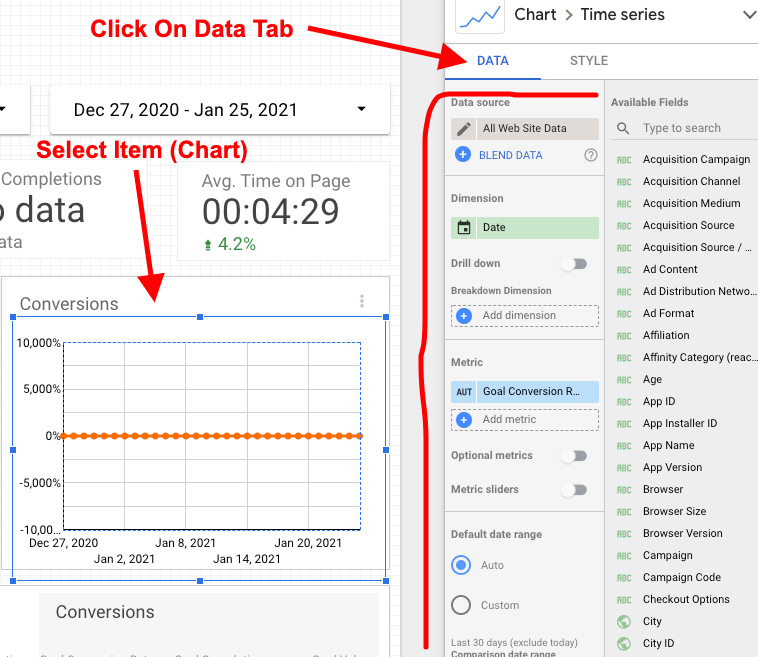
Very similar to how you would update the Style as mentioned above. You would instead click on the Data Tab and update the information you want presented. There are plenty of options for you to customize what type of data is presented and how its calculated. Screenshot below

Recommended Templates
Here are my favorite Google Data Studio report templates:
- Ecommerce PPC Dashboard
https://datastudio.google.com/reporting/0B_U5RNpwhcE6TmpwV2hBOGdKYWM/preview - YouTube Channel Analytics
https://datastudio.google.com/reporting/1ifvnRAcXI8XzkLX1NBBjApcAkaci7BOc/page/JgD/preview - Google Ads Overview
https://datastudio.google.com/reporting/0B_U5RNpwhcE6ckdmZEJ0ZDJXUnM/page/VgD/preview - Google Merchandise Store
https://datastudio.google.com/reporting/0B_U5RNpwhcE6X3kxNHlWcFBrQkU/page/LuBV/preview - Google Search Console
https://datastudio.google.com/reporting/0B_U5RNpwhcE6QXg4SXFBVGUwMjg/page/6zXD/preview - Google Ads Shopping Performance
https://datastudio.google.com/reporting/ce3d8971-385b-46d3-9431-12e925748d93/page/TA6BB/preview - Google Ads Account Health
https://datastudio.google.com/reporting/52d495b8-11ef-40e2-adbc-87f830f29ffd/page/C34BB/preview - Google Analytics Acquisition
https://datastudio.google.com/reporting/e07ba956-b3ae-4f42-a69f-9a30e4023632 - Google Analytics Behavior
https://datastudio.google.com/reporting/6af699aa-328a-49dd-b507-268fe82ad2a6 - Google Ads Video Performance
https://datastudio.google.com/u/0/reporting/ef5da78b-e86e-4cf0-b8e1-5fa2885e3a80/preview
If you have any suggestions that you think deserve to be on this list, let me know in the comments.
Google Data Studio Report Gallery
Click here to get to the Google Data Studio report gallery with all the templates you can ever use.
Any questions, please let me know in the comments!
